Past Event: Mar 24, 2026
Join us at Oracle AI World Tour London 2026
1 min read

Author: Calum Macleod
5 min read
Over the next few weeks we will be publishing a series of blog posts that give you an insight into some of the most commonly used features in Oracle Transactional Business Intelligence (OTBI) for Oracle Sales Cloud. OTBI is an incredibly powerful tool that you can use to visualise the data in your database - with the ability to create interactive tables and graphs to display information to your end users. Knowing where to start in OTBI however can be difficult, so the purpose of this series is to alleviate those difficulties and to help get you started in OTBI by covering a few simple tasks.
Please see below on how to stay updated on the series of this blog posts:
Part I: Choosing which Subject Area to use in an Analysis – Please read below Part II: How to refine your Analysis with filters - Read here Part III: How to add user-facing prompts to your Analysis – Coming soon (sign up here) Part IV: How to set-up conditional formatting on your Analysis – Coming soon (sign up here) Part V: How to embed your Analysis in the Simplified UI — Coming soon (sign up here)
‘Choosing which Oracle Sales Cloud Subject Area to use in Analysis’ is the first blog in our series of ‘Getting Started with OTBI’ blogs - armed with some of these tips and tricks you should be well on your way to creating some interesting and useful reports.
Building a report in OTBI is usually done in an Analysis – this is an area in which you can create queries on the database to visually present data in tables, charts, graphs, etc. The first step is to choose which Subject Area to report on - a Subject Area being a collection of attributes derived from the underlying data tables of the database.
Choosing the right subject area is a crucial first step, however with so many options (many of them very similar) it can be difficult to choose the correct one. Listed below are some of the most commonly used Subject Areas and what purpose they serve.
Sales – CRM Customer Overview | Contains Activities, Contacts, Leads, Opportunities, Products and more – it covers the whole Sales Process. The implicit fact table is Revenue, however, meaning only records associated with opportunity revenue transactions will appear. |
Sales – CRM Customers and Contacts Real Time | This subject area looks solely at Customers and their Contacts, with visibility of every record in the database – not just those linked to transactions. (see comparison in Figures 1 and 2) |
Sales – CRM Forecasting | Allows the analysis of forecast revenues at specific periods (ie. each quarter) and detail (ie. each submitted forecast) levels. Sales Managers can compare forecasts across different periods and against quotas in order to help fine tune future forecast. |
Sales – CRM Pipeline | This subject area allows analysis across all stages of the sales cycle, including lead management, opportunity pipeline management, win-loss, activities and quota management. |
Sales – CRM Historical Pipeline | Similar to CRM Pipeline, but looking only at historic data – thus allowing the analysis of historical trends in the pipeline. The analysis is relative to a ‘Pipeline Snapshot’ measure, and this must have been set up in advance. |
Sales – CRM Sales Activity | Allows the analysis of activities occurring within sales teams, giving Sales Managers the ability to observe whether Sales Reps are making enough contact with customers. |
Alternatively you can create your own subject area to use in OTBI – allowing you to choose the objects most relevant to you and to condense the number of fields listed. For example the Sales – CRM Pipeline subject area contains roughly 1400 fields! As such, creating a custom subject area with a more limited range of objects and fields can be an effective way of speeding up report creation and easing in new users of OTBI (see Figure 3).
Oracle provide a very good walk-through here - http://bit.ly/1NYM97H
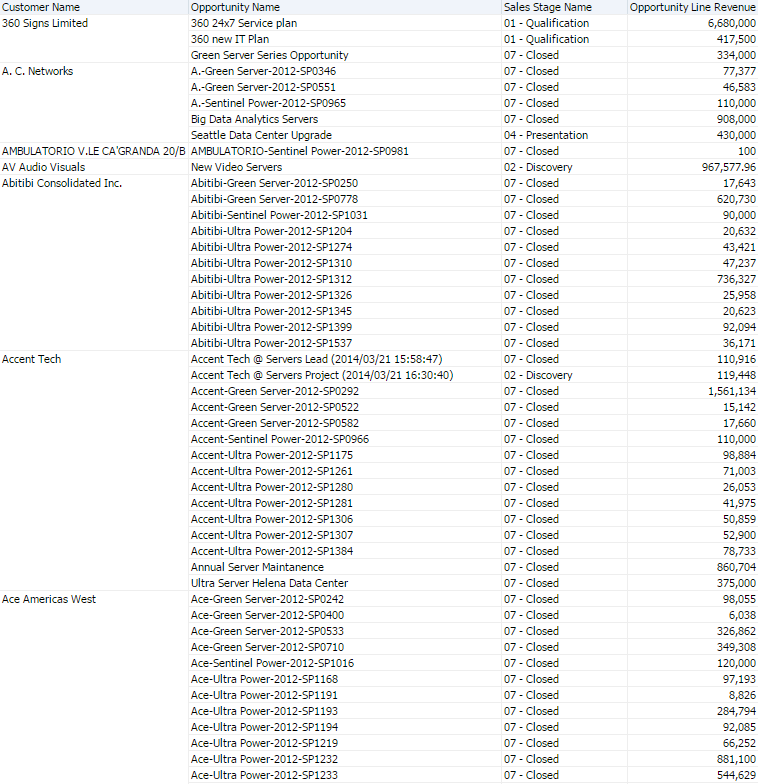
Figure 1 – An analysis on the “Sales – CRM Customer Overview” subject area.
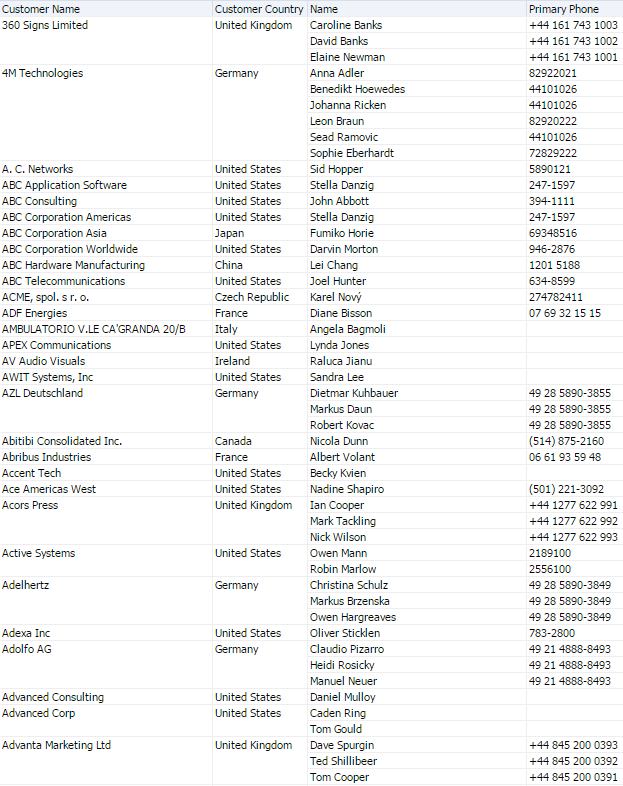
Figure 2 - An analysis on the “Sales - CRM Customers and Contacts Real Time” subject area
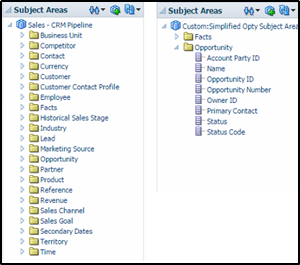
Figure 3 - An OOTB subject area vs. a Custom subject area
Without choosing the correct Subject Area your Analysis can often contain data not relevant to what you want to achieve with your analysis, or quite as easily miss out on some records. As such it is crucial to know which subject area to use before creating an Analysis!
In the next post in this series, we will explore how you can apply filters to your Analysis, which is vital in ensuring that you restrict the data to only those records that are relevant to what you want to achieve - otherwise you’ll have a hard time reading through a table with tens of thousands of records!
Boxfusion Consulting are an Oracle Platinum Partner and recognised by Oracle as Specialised in the implementation of Oracle Sales Cloud and Oracle BI.
If you would like to hear more about how Oracle Sales Cloud and Oracle BI might be used to help your business, or where Boxfusion can help you gain more intelligence from your data, please give us a call on +44 203 283 4315 or contact us here!
 This series of blog posts gives an insight into some of the most commonly used features in OTBI for Oracle Sales Cloud. OTBI is an incredibly powerful tool that you can use to visualise the data in your database.

1 min read
Join us to experience the future of AI and Cloud!
2 min read
Explore how Network Rail provides high-quality information to its customers and users usin...
3 min read