Past Event: Mar 24, 2026
Join us at Oracle AI World Tour London 2026
1 min read

Author: Calum Macleod
6 min read
This series of blog posts gives an insight into some of the most commonly used features in Oracle Transactional Business Intelligence (OTBI) for Oracle Sales Cloud. OTBI is an incredibly powerful tool you can use to visualise the data in your database - with the ability to create interactive tables and graphs to display real-time information to your end users. Knowing where to start in OTBI however can be difficult, so the purpose of this series is to alleviate those difficulties and to help get you started in OTBI by covering a few simple tasks.
Please see below on how to stay updated on the series of this blog posts:
Boxfusion Consulting are an Oracle Platinum Partner and recognised by Oracle as Specialised in the implementation of Oracle Sales Cloud and Oracle BI. If you would like to hear more about how Oracle Sales Cloud and Oracle BI might be used to help your business, or where Boxfusion can help you gain more intelligence from your data, please give use a call on +44 203 283 4315 or contact us here.
‘How to Refine your Analysis with Filters’ is the second blog post in our ‘Getting Started with OTBI’ series. Armed with some of these tips and tricks you should be well on your way to creating some interesting and useful reports.
When building reports, filters are a very useful way of making sense of all your data. Your database is likely to contain thousands of records and by using filters you gain the ability to delve into specific subsets of the data that you are interested in. For example you may wish to analyse Opportunities which are in a certain sales stage or look at Accounts in a certain industry. The following example demonstrates how to apply a filter to a numeric column.
Create a simple report with a variety of columns, including one fact/numeric column.
Figure 1 - An unfiltered Analysis on the "Sales - CRM Pipeline" Subject Area
Under the criteria tab, click to Create a Filter. In our example we chose to filter on Opportunity Line Revenue.
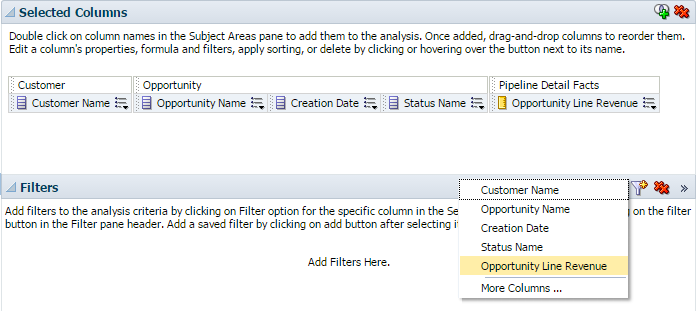
Figure 2 - Adding a Filter from the Criteria Tab
A pop-up box will appear and here you can edit your filter with a range of operators to choose from – this includes equal to, between, is null, is in top, begins with, etc. We choose to filter for Opportunities with Line Revenue greater than or equal to 1,000,000.
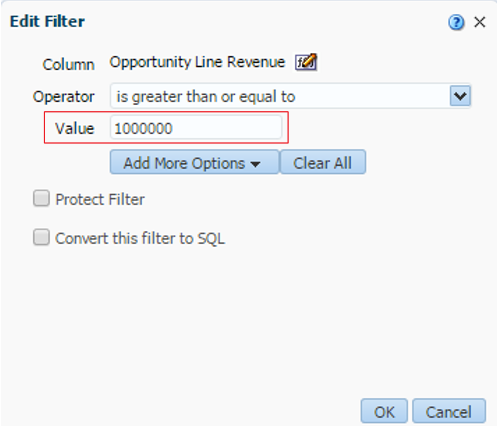
Figure 3 - Creating your Filter
Now navigate to the results tab. You will see that all Opportunities with a Line Revenue less than 1,000,000 have been filtered out.
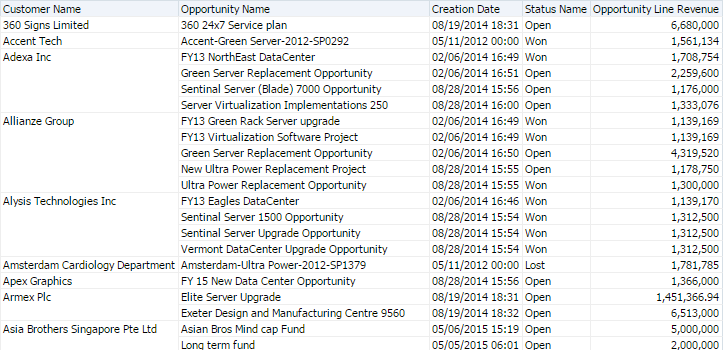
Figure 4 - The same Analysis after applying the Filter
A common use case for applying a filter is to find Row IDs – which are often needed for file-imports, web services and other customizations. The easiest method to find these 15-character numeric strings is to use OTBI and apply a filter. For example you could create an analysis with the columns Customer Name and Customer Row ID, and then filter by the name of the Account. From there you can copy the ID or export the analysis to excel.
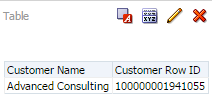
Figure 5 - An Analysis filtered on the name "Advanced Consulting"
An identical process can be carried out to find the IDs of Contacts, Opportunities, Leads and other objects. The ID attribute is likely to be named “[Object] Row ID”, “[Object] ID” or “Party ID”.
In addition to filtering by constant values, you can also use session variables to add greater functionality to your filters. For example you could filter on the current date/time, or on the user ID of the person logged in – which is useful if you wanted to only see records that are relevant to yourself.
While in the create filter screen, you must click on the Add More Options button, then choose Session Variable.
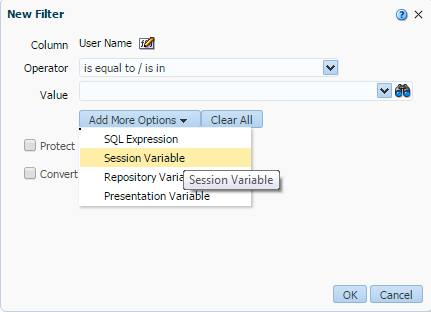
Figure 6 - Adding a Session Variable to a Filter
A new text box will appear, where you can define your session variable. In this example we chose to filter on the username of the current user, by entering “USER” into Session Variable.
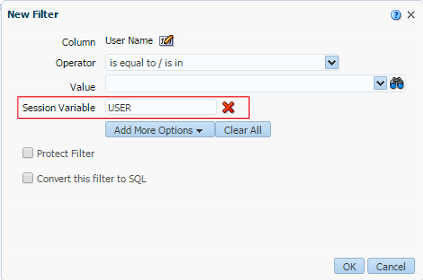
Figure 7 - A Session Variable of Username is applied
This creates a filter which is displayed in OTBI as Column is equal to/in @{NQ_SESSION.USER}, with the NQ_SESSION denoting that it is a session variable.
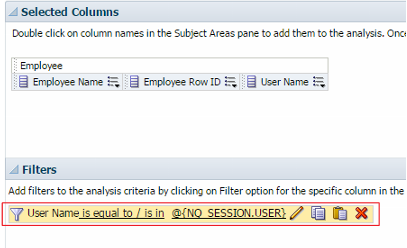
Figure 8 - How filtering by this Session Varible would display in the Critera Tab
A selection of Session Variables are listed in this Oracle documentation.
Finally, filtering by date variables is very useful when you want to restrict the analysis to a certain time-period, e.g. after today, the past 7 days, or next quarter.
This time in the create filter screen, you check the box Convert this filter to SQL, then click OK.
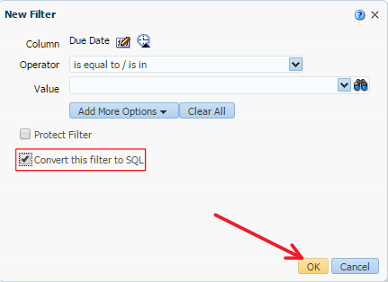
Figure 9 - Converting a Filter to an SQL Statement
In the Advanced SQL Filter pop-up that appears, you can write an SQL expression to define your filter. We choose to filter on Due Date in the future, so enter “Activity”.”Due Date” > CURRENT_DATE
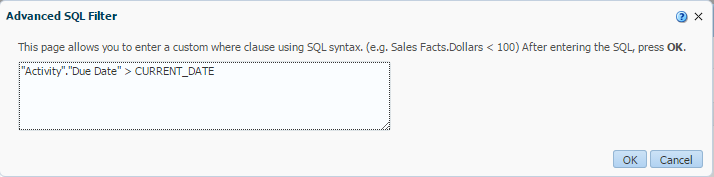
Figure 10 - Defining a Filter by an SQL Statement
Here we are using the variable CURRENT_DATE, which uses the date of your Oracle environment to filter the analysis, updating each time the report is queried. Other date variables include CURRENT_TIMESTAMP, DAY_OF_MONTH, QUARTER_OF_YEAR, etc.
To filter for a dates in a certain time-period it is best to use the TIMESTAMPADD function and the BETWEEN operator. If we wanted to filter on the previous 7 days we would use the SQL statement:
“Activity”.”Due Date” BETWEEN TIMESTAMPADD(SQL_TSI_DAY, -7, CURRENT_DATE) AND CURRENT_DATE
Documentation on TIMESTAMPADD can be read here. Note too that all date and time functions use the user's current timezone (as set in their Sales Cloud preferences) as their basis.
Without using filters, an analysis is just a mass of data - very difficult to read and very unlikely to yield any useful information. By applying filters, we can use OTBI to visually answer complex questions about our data.
Look out for the next post in this series, where we will look into how to add user-facing prompts to your reports. These are filters which are interactively-controlled by your end users, giving them power to customise reports and further target the data they want to see.
If you would like to hear more about how Oracle Sales Cloud and Oracle BI might be used to help your business, or where Boxfusion can help you gain more intelligence from your data, please call us on +44 203 283 4315 or contact us here.


1 min read
Join us to experience the future of AI and Cloud!
2 min read
Explore how Network Rail provides high-quality information to its customers and users usin...
3 min read