Blog by John Dunsmuir
Browser UI Extensions: Establishing Best Practices for a Novel Framework
6 min read
As part of our internal review of new OBIEE releases, I have upgraded one of our environments from 11.1.1.7 to 11.1.1.9. There is a range of great new features in 11.1.1.9 and for a complete list as always you can sift through the Oracle release documentation which can be found here. But having worked with the release for some time now to save you from this, take a look below at my list of key new features that developers and business users can look forward to benefiting from.
The interface has changed and now looks much more like Oracle BI Cloud Services (BICS), this makes sense though since BICS is normally a few patches ahead of on-premise BI. Although it hasn't changed dramatically I have to say that I prefer the new interface - it's cleaner and easier to look at than the old version.
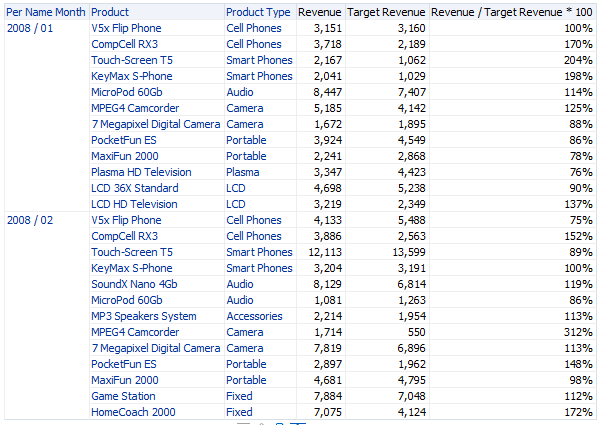
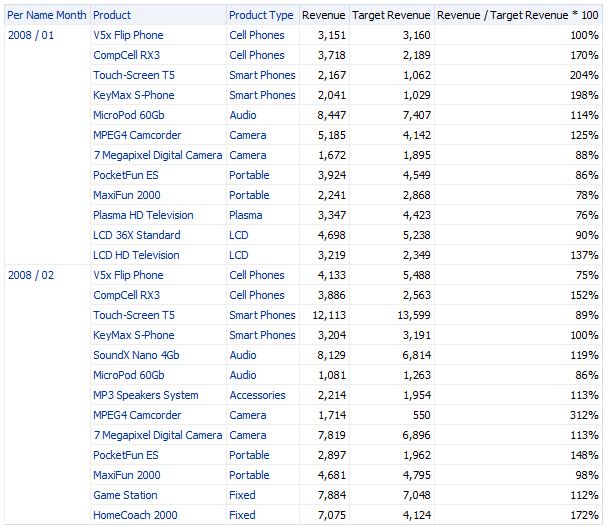
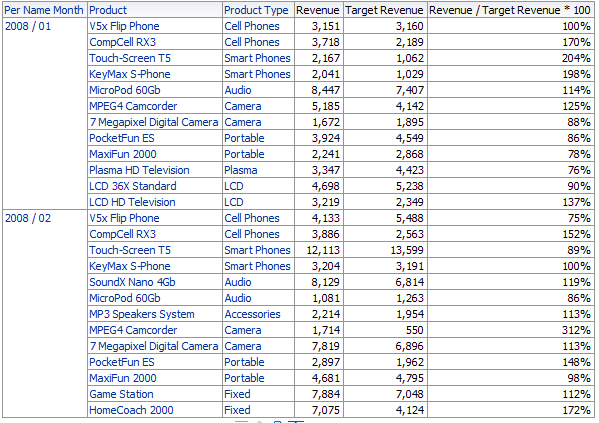
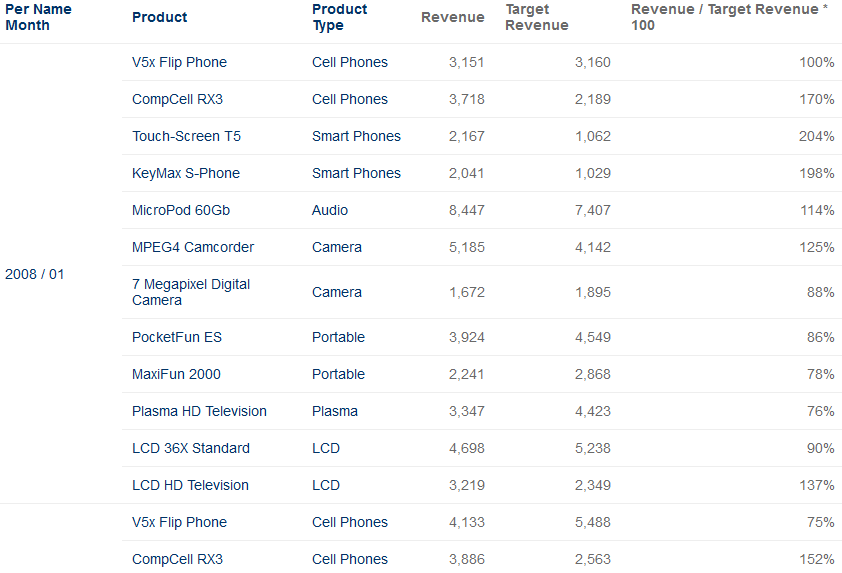
Here is a direct comparison between an 11.1.1.7 and 11.1.1.9 analysis results screen:
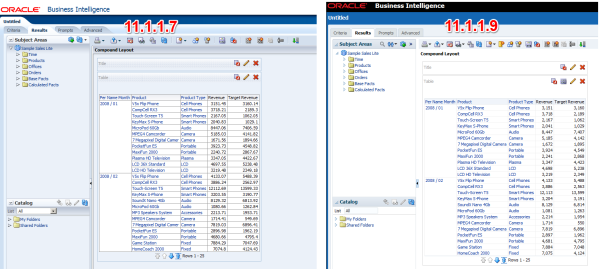 Fig 1. Comparison between 11.1.1.7 & 11.1.1.9
You now have the ability to create a new calculated measure from the Results tab of an Analysis. Clicking the Create Calculated Measure button will take you to the New Calculated Measure screen where you can then insert a formula and add the column directly into your report without having to navigate back to the Criteria tab.
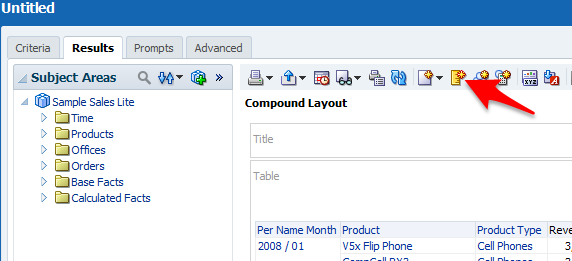
Fig 2. Adding a new Calculated Measure
From the Criteria tab of an Analysis you can now save a column to the BI catalog so that it can be reused, any changes to the saved column will then be reflected in all of the Analyses where it is included. You can also insert a copy of the calculated measure into an Analysis, that way you can override the function without affecting the original column.
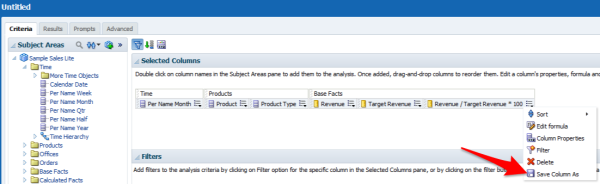 Fig 3. Saving a column to the Catalog
Once saved, you can insert it into another Analysis the same way you would insert a saved filter.
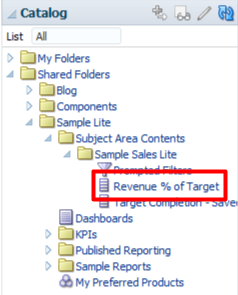
Fig 4. Inserting the saved column
A nice new feature of 11.1.1.9 is the ability to search for objects within a Subject Area while creating or editing an Analysis. In the screen capture below I've searched for the word "offic", you'll notice that it returns everything, folders and hierarchical columns included, containing "offic". You can use % as a wildcard character in your search too and change the order of the results using the new sort button.
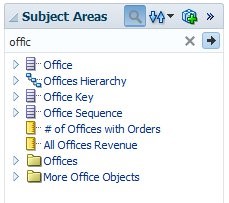
Fix 5. Searching & sorting options
This is not something I've been desperate for but now that I see it in action I think this will be an enormous help for anybody creating an Analysis over a large subject area.
As well as the default layout being changed from FuisionFX to Skyros you are now able to preview what an Analysis will look like in all of the different layout styles. When creating an Analysis, clicking on the preview button will allow you to select from a list of preview styles to choose from. You'll also notice that a new SkyrosCloud style has been added but the difference between this and Skyros is negligible.
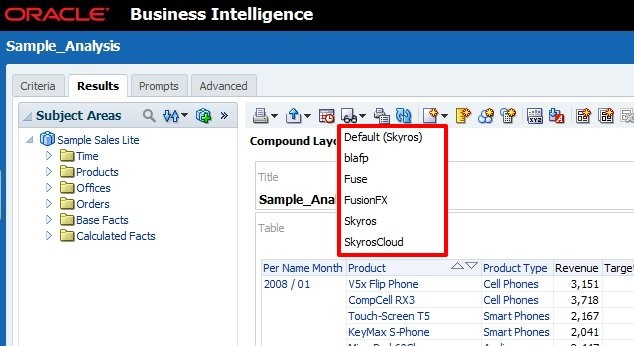 Fig 6. A list of the preview options available
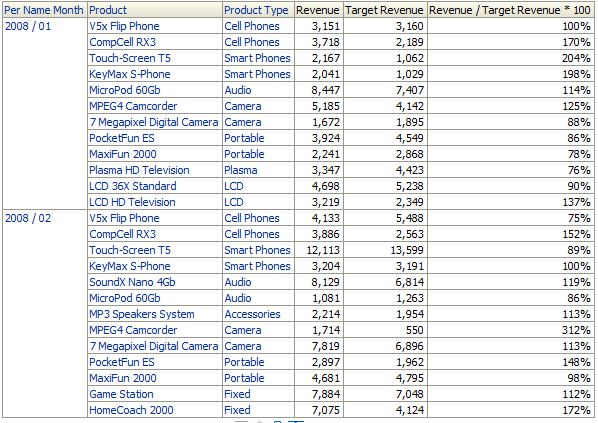
Here is a look at the results of an analysis in each of the different styles if you're interested:
Probably the most significant change for end-users is the addition of the new Treemap chart in 11.1.1.9. Treemaps are a great way for users to identify patterns in their data which would otherwise be very difficult to spot; they allow you to visualise data in the form of nested rectangles of varying colours and sizes depending on the measures that you've assigned.
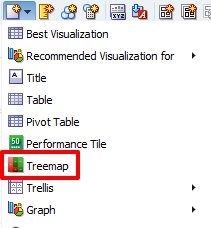
Fig 7. Adding a Treemap
As you can see below I've created a Treemap where the colour and size of the tiles represent the % of target revenue and revenue measures respectively. The fields which are being grouped by are represented by a series of nested rectangles, in this case the hierarchy is Department -> Product Type -> Product. You can also add prompts and sections to the Treemap just like other chart views and you can also adjust the colours and binning properties of the Treemap too.
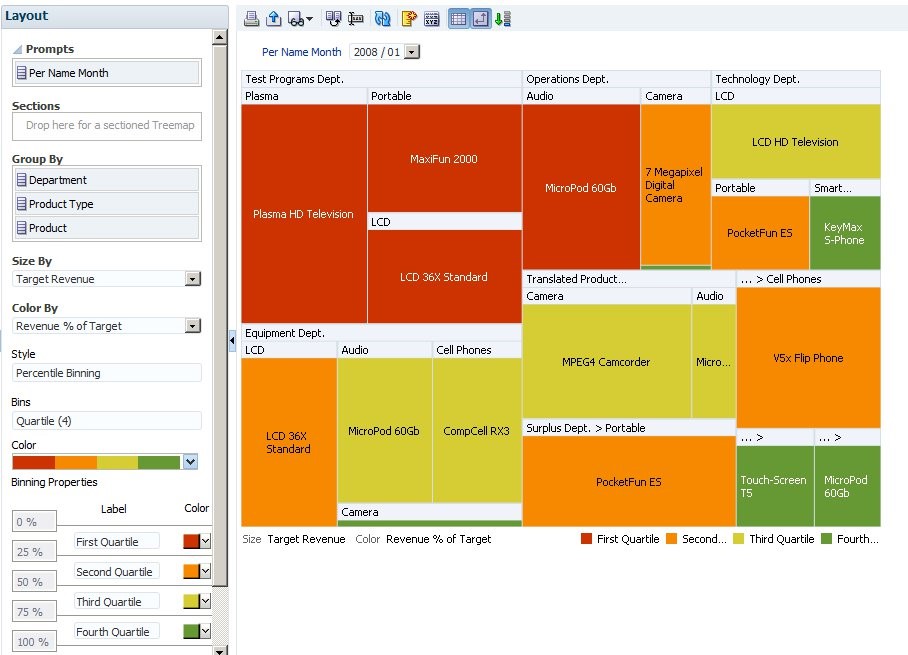 Fig 8. Editing the Treemap
Another new feature of 11.1.1.9 worth mentioning are Global Variables. Global Variables are very similar to Saved Columns in that they are a way of defining a formula or constant value which can then be reused; a Global Variable however, can be referenced from inside another formula which makes it more suitable for certain situations. A Global Variable would be used when you have a frequently used complex formula where you anticipate users will want to wrap other formulas around it without changing the underlying calculation.
To use a Global Variable: edit a column formula and click on the Variable drop-down and select Global.
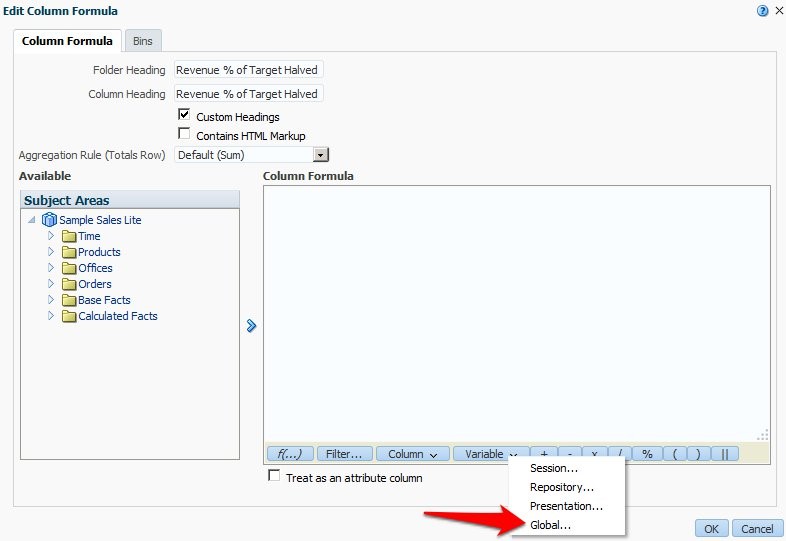 Fig 9. Adding or Referencing a Global Variable
Hit the plus icon to add a new Global Variable or choose one from the list to include in your column formula. I have created a Global Variable that calculates the revenue as a percentage of the target revenue.
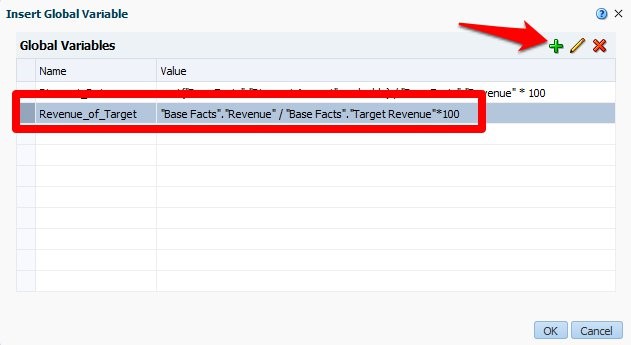 Fig 10. Selecting or creating the Global Variable
Now you can use the Global Variable in your calculation, here I am dividing the value by 2 as an example. If the underlying calculation for the variable changes it will automatically flow through to this calculation too.
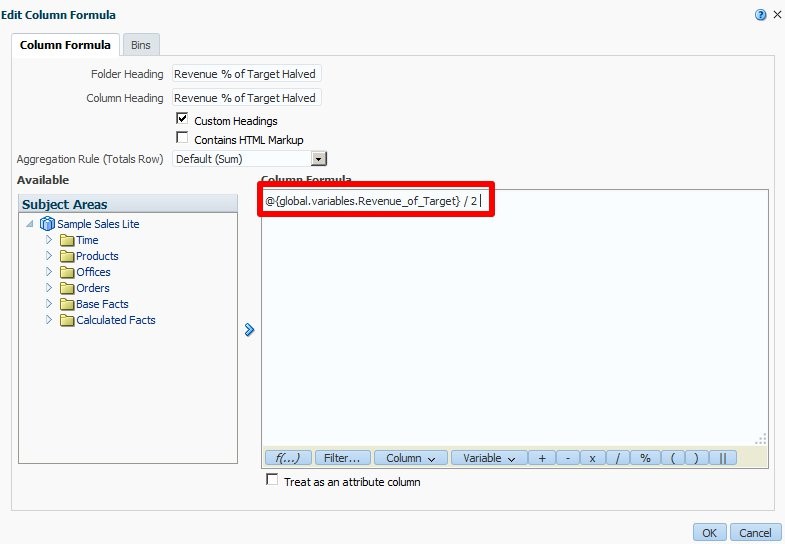 Fig 11. Referencing the Global Variable inside a formula
Global Variables are a nice addition to OBIEE, especially for those users who do not have access to create reusable repository attributes/measures.
As you can see there are some nice new features available in the latest installment of OBI for end-users and report developers - who will probably benefit the most out of this new release. The developers and administrators out there shouldn’t feel left out however because there are some cool new improvements for you too, here is a quick list of the most significant:
Boxfusion Consulting are an Oracle Platinum Partner and are recognised by Oracle as Specialised in the implementation of Oracle BI technology.
If you would like to hear more about how Oracle BI might be used to help your business please give us a call on +44 203 283 4315 or contact us here!


6 min read
4 min read
The latest version of Siebel has many great architectural features to improve support...
2 min read