Resource
Reshaping Service Experience in 2025 [eBook]
1 min read
The Oracle Service Cloud Customer Portal offers a variety of different enhancements to help improve customer experience. One example we have recently been looking at is providing customised map widgets using Google Maps API to enhance the UX. Google Maps provides an API which can be used by developers to embed a map on a webpage, and we have used this API to create two widgets that visualise data about incidents and locations. The Personalised Directions widget and Incident Mapping widget are both personalised for the end user, aimed at enriching their experience when using the Customer Portal pages.
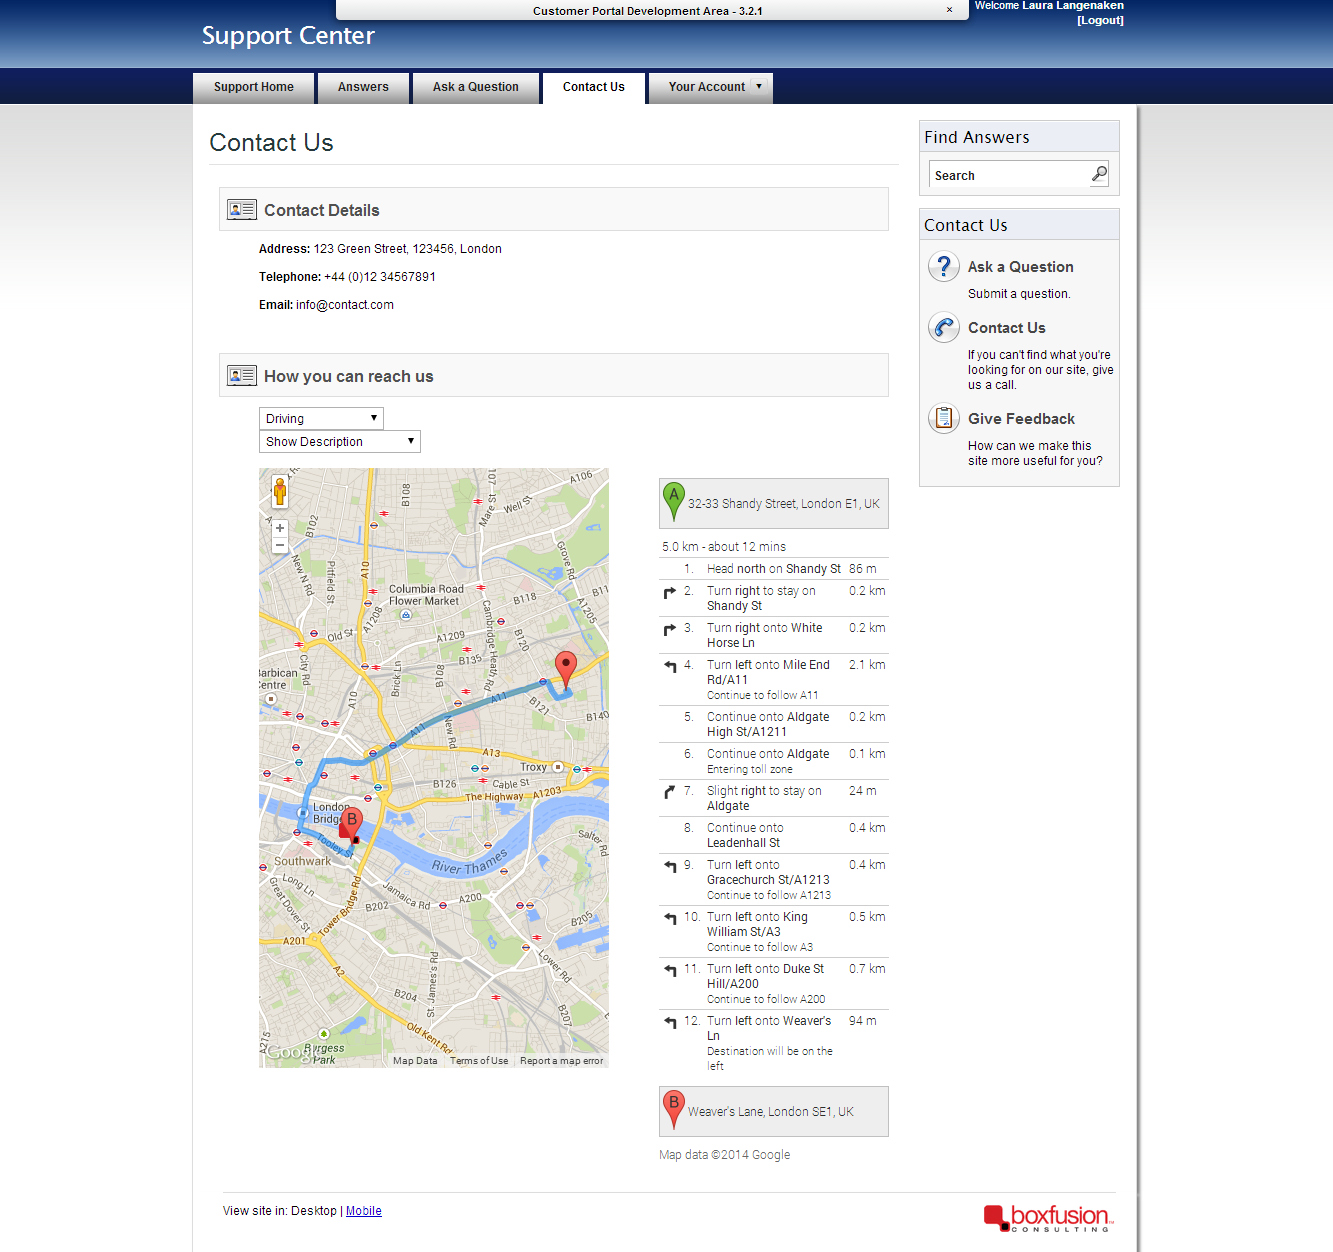
The first widget shows a map with the location of the user, a company’s head office or local store, and the route between the two. This type of widget could be used on a Contact Us page of a website enabling the end user to easily navigate their way to the closest store as their location is automatically plotted onto the map. The map could also include a number of location options and offer the end user the choice of stores based on distance from their current location.
Figure 1 shows an example implementation. Just like on the standard Google Maps website, step by step directions can be added in a sidebar and the end user can select their preferred method of transportation.
The second widget, shown in figure 2, maps all incidents based on the location of their primary contact. A marker can be used to give a clear visualisation of the incidents’ resolution status, red for all unsolved incidents and green for solved. This widget could be used by companies that would like to give their clients an overview of all incidents that have been resolved over the last 24 hours. A train company could inform their clients about ongoing and resolved issues on the line, for instance.
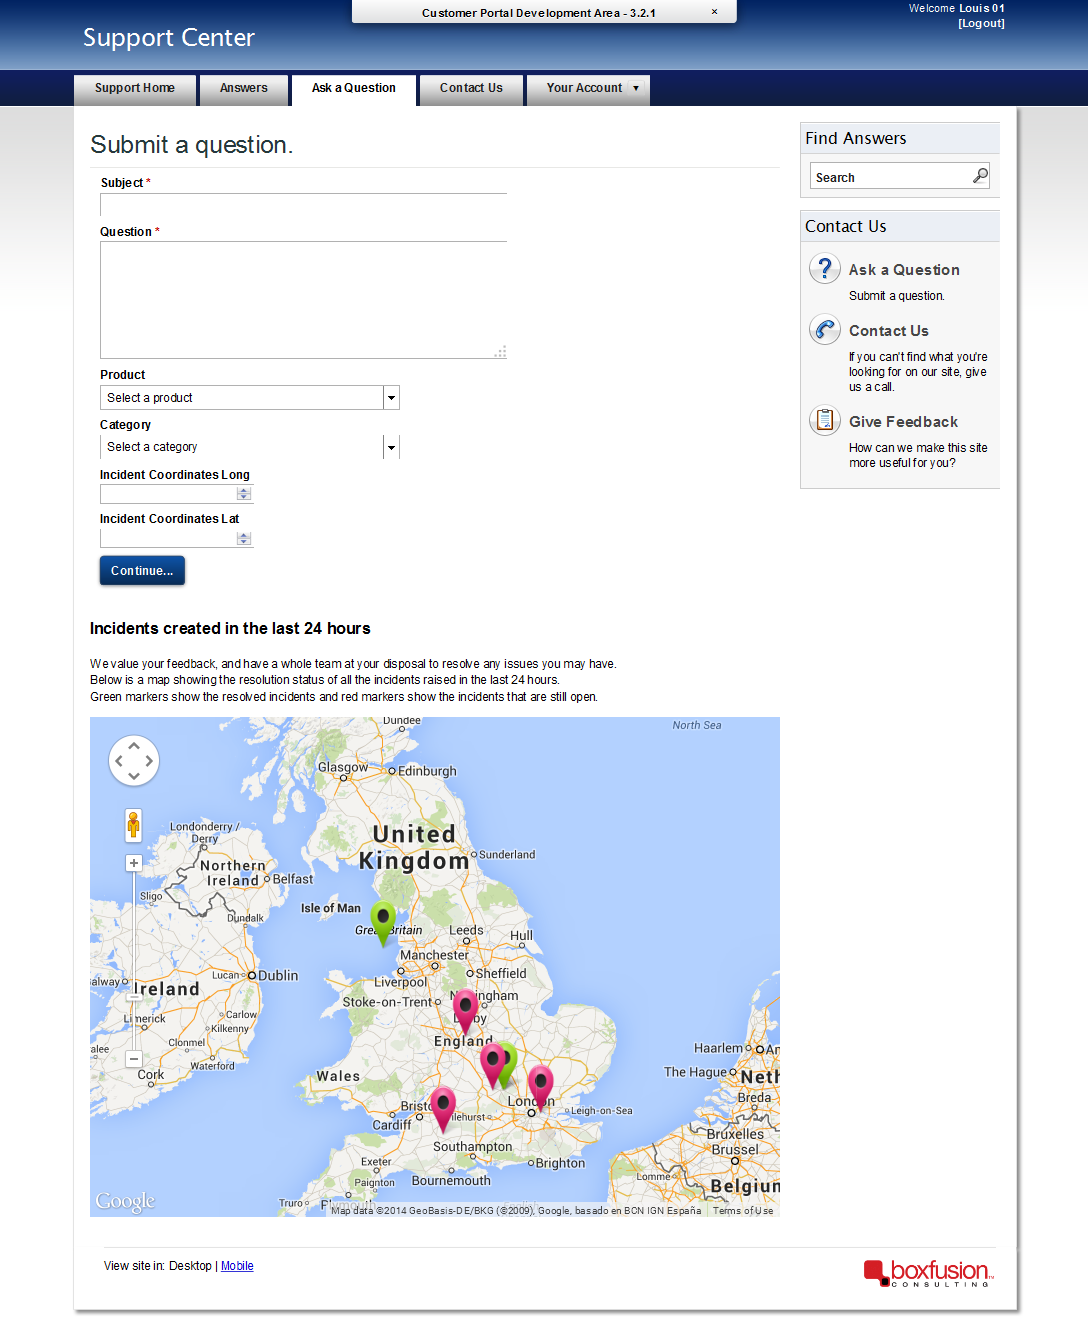
Another example use for this widget could be a County Council that wants to show all locations that need road improvements. End users can create their own incidents simply by clicking on the map on a specific location as shown in the video below. This is a straightforward and time-saving experience for the user. The visualisation of existing incidents also avoids users reporting the same issue several times, thereby deflecting the requests and saving valuable agent time.
[video width="600" height="460" mp4="https://www.boxfusionconsulting.com/wp-content/uploads/2014/09/Incident-Map-4.mp4"][/video]
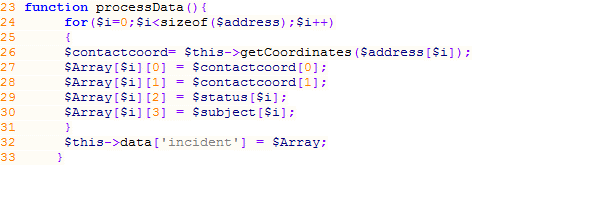
The incident mapping widget is a custom widget which uses the MVC design pattern. A few relevant fragments of the code have been added below for clarification. The relevant incidents are selected with a ROQL query, after which their status (solved/unresolved), subject and the primary contact address are retrieved by calling a custom model called 'MapsModel'.
![]()
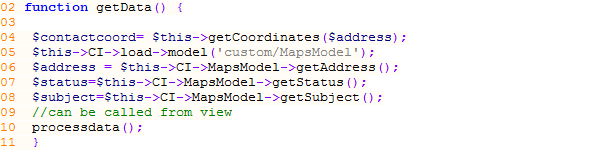
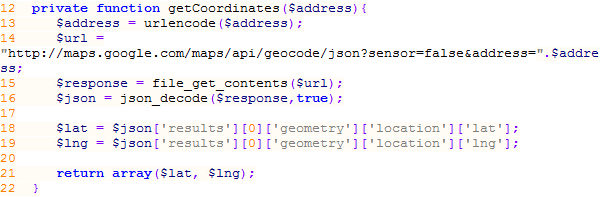
In line 4 above, a function is called which uses the address details to retrieve the coordinates of the location.
All relevant information is saved in an array, which is being passed to the View.
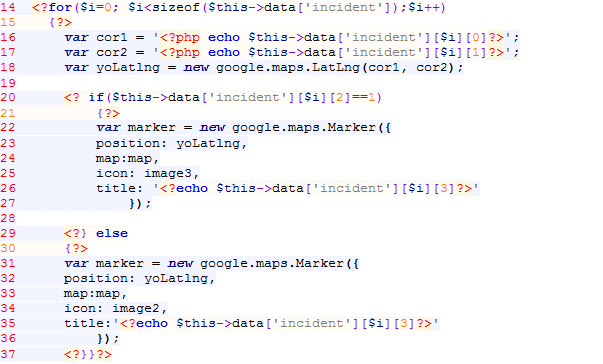
The View uses the Google Maps API to visualise the data it gets from the controller. The array is used to create markers for each incident in the array, and the status determines the colour of these markers. Hovering over a marker shows the subject title of that incident.
The Personalised Directions and Incident Mapping widgets are just two examples of how the Google Maps API can be integrated within the Customer Portal, to both visualise and interact with information from the database.
We've seen how these can be used to enhance the customer experience and, in the case of the interactive map, increase the deflection capabilities of Service Cloud by allowing users to visually validate the existence of a geo-tagged incident before submitting their own. Hopefully this blog post has gone some way towards demonstrating how different data visualisation techniques can be used to enhance the Customer Portal user experience - please look out for future blog posts where we will explore this area further!
If enhancing your customers’ experience is a priority for your organisation, why not contact us, or call us now on +44 203 2834315, to discuss how your organisation can benefit from using Oracle Service Cloud.
You can also read more about our Oracle Service Cloud Services here.
1 min read
Explore how Network Rail provides high-quality information to its customers and users usin...
3 min read
Learn how Smeg delivers excellent customer service by leveraging Oracle's Generative AI an...
3 min read