Past Event: Nov 09, 2023
Retrouvez Boxfusion Consulting lors de l’événement Oracle Applications Unlimited Days, en France
1 min read

Author: Geraint Thomas
7 min read
Performance is a critical factor in usability, as well as productivity, for Siebel users. When Open UI was introduced it added a new layer that sits on top of Siebel and which could ultimately impact the responsiveness of the Siebel application. In this blog post we seek to identify the factors that influence Siebel Open UI performance.
To aid in this analysis we have developed a tool (tested with Siebel 8.1.1.14 patch set 1) to capture Open UI performance statistics. This tool is an extension of the code first developed by Duncan Ford of Oracle.
To understand the factors affecting Open UI performance, let’s first take a look at what is happening when a Siebel Open UI view is shown to a user.
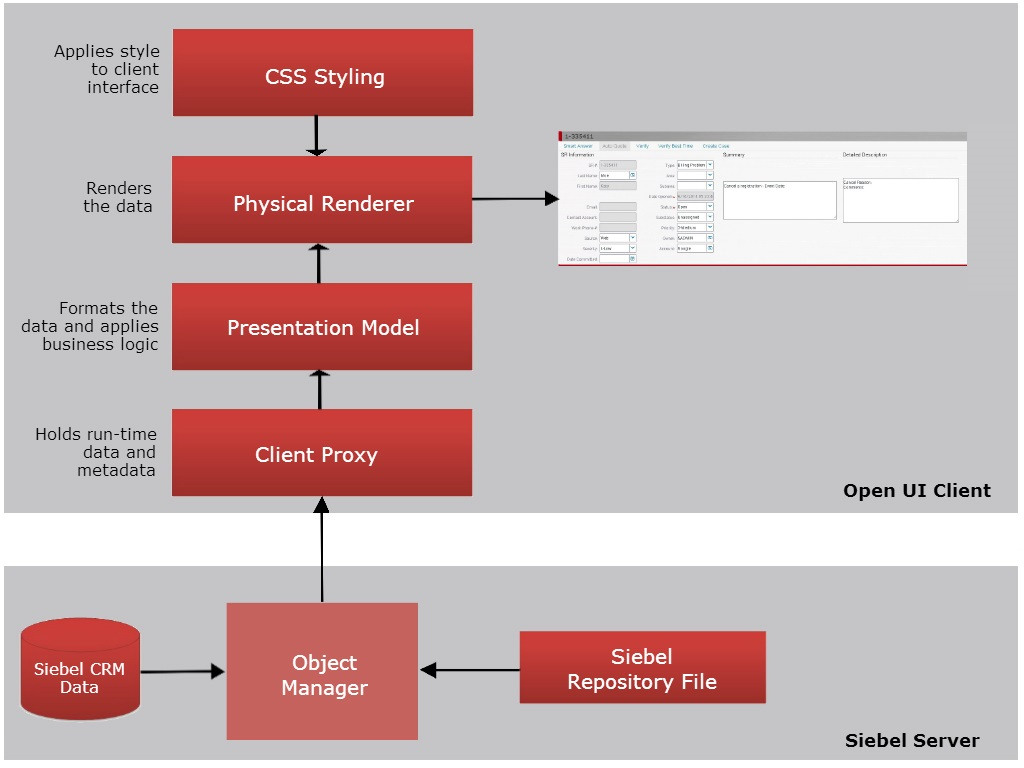
Figure 1 - Basic Architecture for customizing Siebel Open UI
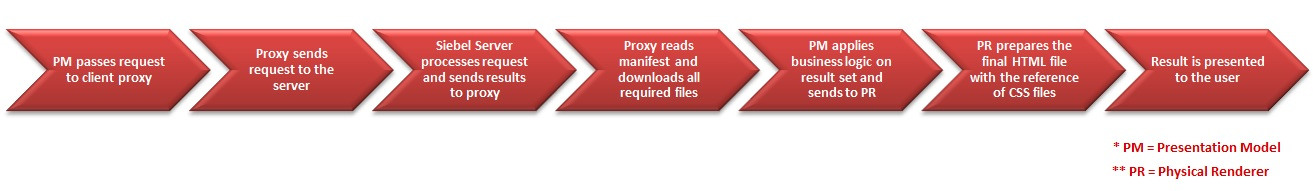
Figure 2 - Open UI rendering process flowchart
The diagram of Figure 1 looks at the basic architecture of Open UI while the flowchart in Figure 2 is a simplified explanation of what happens step by step when Open UI is rendering the application. Let’s have a closer look at the flowchart in Figure 2.
Step 1: The Presentation Model captures the event and sends the corresponding request to the client proxy. Step 2: The client proxy checks the memory cache for the required data to complete the request. If relevant information is found in the memory cache then the process moves directly to step 4. If not, a request is sent to the Application Object manager on the Siebel Server to get the record set. Step 3: The Application Object Manager processes the request and sends the corresponding record set back to the client proxy. Step 4: The proxy client checks the manifest definitions and downloads all of the JS and CSS files required to display the view the user wants to access. Step 5: The Presentation Model applies business logic on the retrieved record set, incorporating information from the JS files. Step 6: The Physical Renderer generates the final HTML files taking into account the regarding CSS files. Step 7: The finalized HTML is displayed in the browser.
From the flowchart above you can easily see that the whole process can be broken down into two parts. The first part includes the first three steps (the process of retrieving data from the Siebel Server), while the second part includes steps 4 to 7, where the actual rendering is taking place. Contacting the Siebel Server takes place in both High Interactivity clients and in Open UI clients; however the second part of this process (steps 4-7) is specific to Open UI.
So what are the factors that impact the time taken to render data in Open UI?
To answer this question we have built a tool to capture the time it takes to load a Siebel view using Open UI, based on a script originally produced by Duncan Ford of Oracle. The tool is capturing the time that has elapsed between the preload and postload events, which includes any custom js files applied on the views being accessed as well as vanilla scripts such as pmodel.js and phyrenderer.js. All the information captured by the script is stored in the Siebel database and presented in an administration view where the different test outcomes can be compared and a visualization of the results using the Google Charts API can be seen.
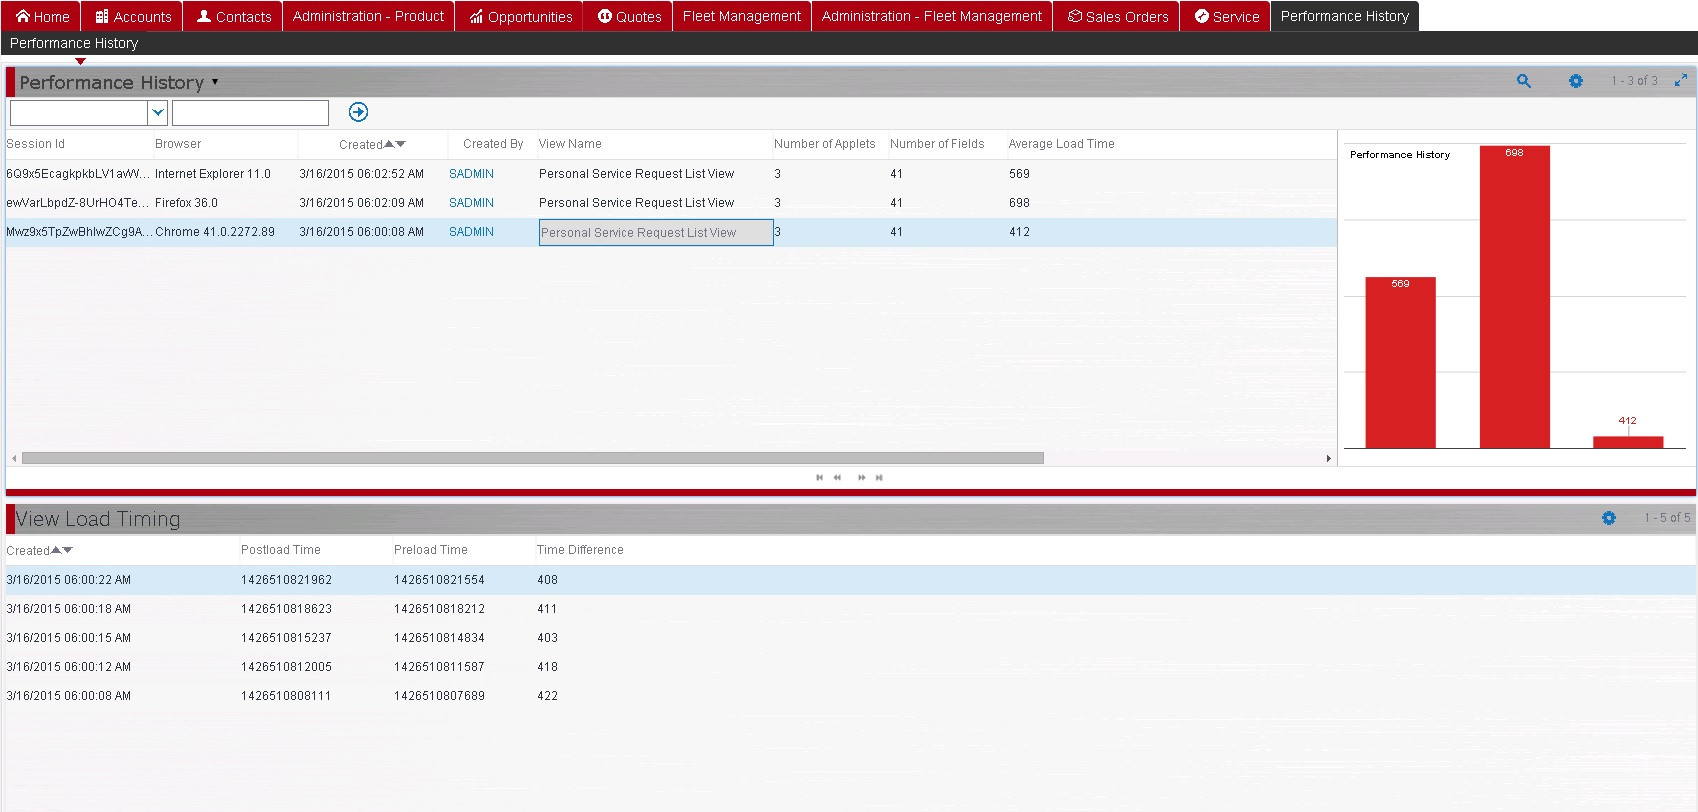
Figure 3 - Boxfusion Performance History Administration view
The top applet describes the average loading time for a given Siebel view and browser type combination, while the lower applet shows performance information relating to the captured instances of that particular browser type accessing that particular view.
Having the ability to capture and analyse performance information from different testing scenarios allows us to gain a better understanding of the factors affecting the performance of the Siebel application in regards to Open UI. We have run a series of different tests, some of which we have gone into detail below.
Scenario 1: Accessing a view for the first time vs accessing the same view subsequently (i.e. once files are cached and don’t need to be downloaded again)
Accessing a view for the first time downloads any required files such as custom js and css files that are used by the specific view. For any consecutive visits this is not required as the files are cached, which means that the first time the view is accessed its load time will be slower than on any subsequent visits. To put that to the test we navigated to the Personal Service Request List View several times and studied the result set in the Performance History Administration view. The time it took to load this view differed depending on whether it was the first time the view was being accessed, as well as which browsers were used to access it.
The biggest difference captured was when using Mozilla Firefox, where the first time the view was accessed took 842ms and every other time near 650ms.
Scenario 2: Accessing views with a different number of applets and fields
Loading views with a large number of applets and fields would typically be expected to take more time than loading a simple view with two applets. We ran a series of tests accessing views with different numbers and types of applets and fields to study how adding more of each to a view affects the performance of the application. A subset of results are below:
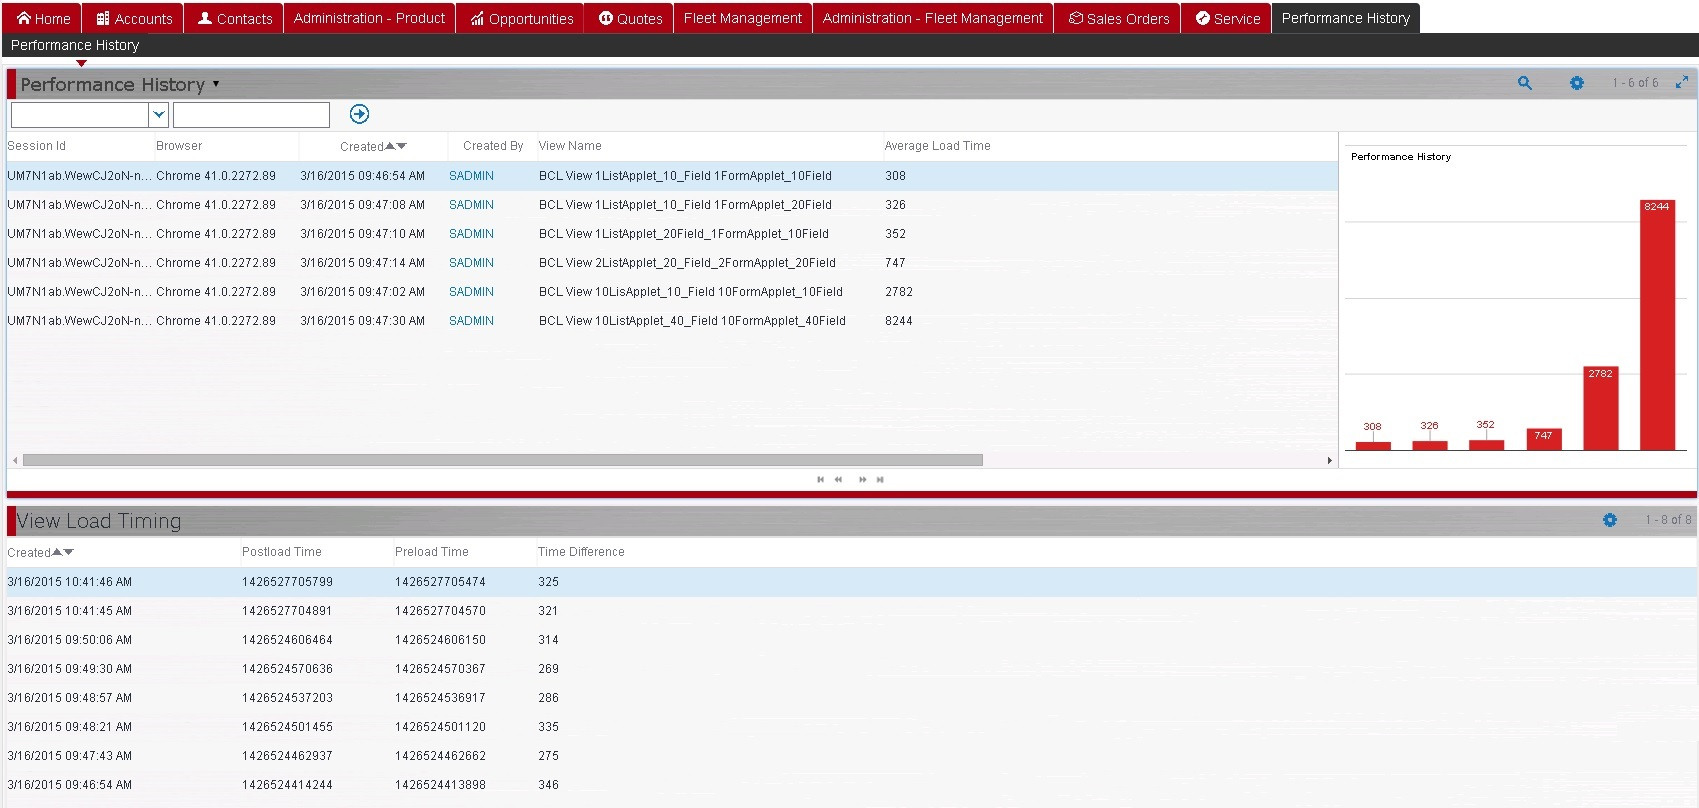
Figure 4 - Boxfusion Performance History Administration view - Result set for accessing views using Google Chrome
| Browser | Number of Applets | Number of Fields | Average Load Time (ms) |
| Chrome | 2 | 20 | 304 |
| Chrome | 2 | 30 | 326 |
| Chrome | 2 | 30 | 352 |
| Chrome | 4 | 80 | 735 |
| Chrome | 20 | 200 | 2782 |
| Chrome | 20 | 800 | 8244 |
Table 1 - Test results for accessing views using Google Chrome
You can see from the table above that the main factor affecting the performance of the application is the number of fields on the view. In the first three test scenarios the views in question include only two applets (one List Applet and one Form Applet). Adding ten extra fields either on the List Applet or the Form Applet increases the loading time of the view slightly, with a bigger impact being seen when the fields were added on the List Applet. In the fourth test view we have 4 applets in total with 20 fields each and the average loading time has been more than doubled in comparison to the first simple test view. Finally, in the last two test scenarios we have kept the number of Applets the same (ten List Applets and ten Form Applets) but we increased the number of fields from 200 to 800.
From the results, it is very clear that increasing the number of fields on a view has a huge impact on the performance of the application (the loading time in our case increased by almost 75%).
Scenario 3: Accessing a view using different browsers.
Another test very much worth performing is accessing the same views but with different browsers. This allows us to judge which browser is more compatible with Open UI (or a customer's particular implementation of Open UI). We have included a sample results set below:
| Browser | Number of Applets | Number of Fields | Average Load Time (ms) |
| IE11 | 2 | 20 | 408 |
| Firefox | 2 | 20 | 341 |
| Chrome | 2 | 20 | 304 |
| IE11 | 2 | 30 | 522 |
| Firefox | 2 | 30 | 389 |
| Chrome | 2 | 30 | 326 |
| IE11 | 2 | 30 | 520 |
| Firefox | 2 | 30 | 387 |
| Chrome | 2 | 30 | 352 |
| IE11 | 4 | 80 | 1015 |
| Firefox | 4 | 80 | 655 |
| Chrome | 4 | 80 | 735 |
| IE11 | 20 | 200 | 4487 |
| Firefox | 20 | 200 | 2356 |
| Chrome | 20 | 200 | 2782 |
| IE11 | 20 | 800 | 14884 |
| Firefox | 20 | 800 | 6202 |
| Chrome | 20 | 800 | 8244 |
Table 2 - Test results for accessing views using IE11, Mozilla Firefox and Google Chrome
In all cases Internet Explorer seems to be the slowest to load each view, regardless of the number of applets and fields in the views. However there is a very interesting pattern displayed by Mozilla Firefox and Google Chrome - Chrome is faster than Firefox when it comes to views with a small number of fields but becomes much slower when this number increases. In the screenshots below you can see this difference in the results sets:
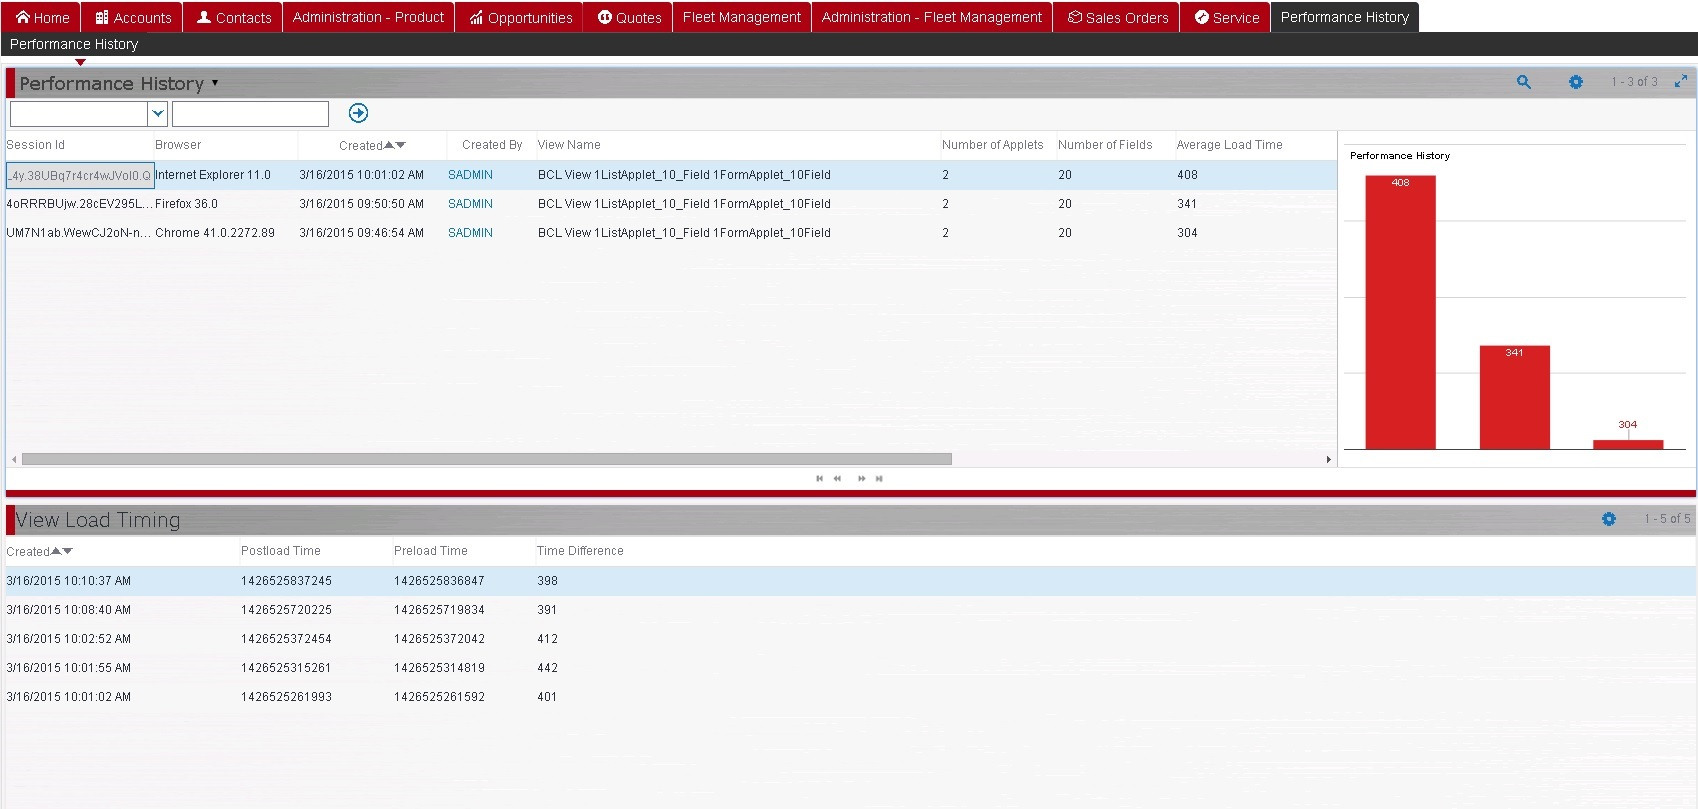
Figure 5 - Boxfusion Performance History Administration view - Result set for accessing a view with a small number of Applets and Fields
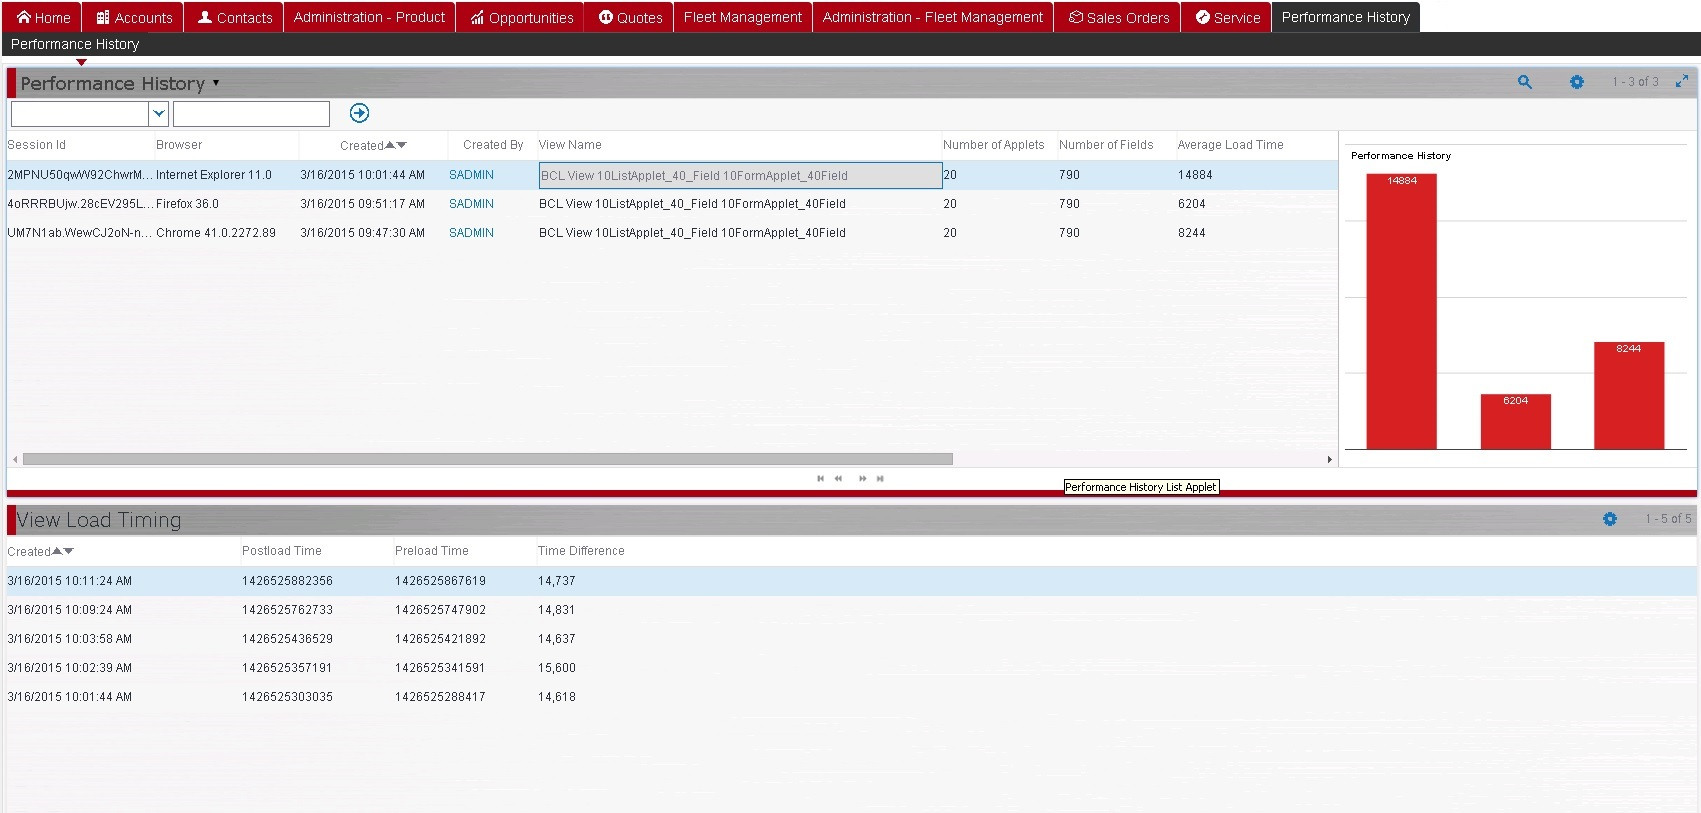
Figure 6 - Boxfusion Performance History Administration view - Result set for accessing a view with a large number of applets and fields
The results of the test scenarios above suggest that the biggest factor influencing Open UI performance is the choice of browser, while a secondary factor is the number of fields displayed on a single applet. This second factor correlates with a key Siebel design principle of not overloading the Siebel UI with fields which adversely affect the usability of the application.
Equally importantly, this exercise serves to highlight that leveraging a tool such as this one within Open UI development processes can really help to assure the performance of the resulting Siebel application, by providing an evidence-based approach to configuration and browser recommendations.
Look out for our future blog posts about Siebel and Open UI or explore our other Open UI blog posts to gain a better understanding of how you are able to exploit the benefits of Open UI to the full.
Alternatively, you can read more about our OpenUI Services here or contact us for further information!

1 min read
5 min read
5 min read